Class 8 Mathematics MCQ Data Handling with Answers is Prepared Based on Latest Exam Pattern. Students can solve NCERT Class 8 Mathematics MCQ Data Handling with Answers to know their preparation level.
Students who are searching for NCERT Class 8 Mathematics MCQ Data Handling with Answers are compiled here to get good practice on all fundamentals. Know your preparation level on MCQ Questions for Class 8 Mathematics MCQ Data Handling with Answers. You can also verify your answers from the provided Class 8 Mathematics MCQ Data Handling with Answers. So, ace up your preparation with MCQ of Class 8 Mathematics MCQ & NCERT Textbook solutions Examinations.
NCERT Class 8 Mathematics MCQ
Data Handling
with Answers
Question : The width or size of the class interval 30-40 is:
(a) 10
(b) 30
(c) 40
(d) 70
Answer : (a)Show Answer :
Explanation: Width of class interval = upper class limit-lower class limit
= 40-30
= 10
Question : If a coin is flipped in the air, what is the probability of getting a tail?
(a) 0
(b) ½
(c) 1
(d) 2
Answer : (b)Show Answer :
Explanation: A coin has two sides, Head and tails.
Hence, probability = Number of possible outcomes/Total number of outcomes
We know, Tail is present on one side of a coin and in total there could be two outcomes H&T
Hence, Probability = ½
Question : A bag has 4 red balls and 4 green balls, what is the probability of getting a red ball randomly?
(a) 1/4
(b) 1/8
(c) 1/2
(d) 0
Answer : (c)Show Answer :
Explanation: Total number of balls in bag = 4+4 = 8
Total number of red balls = 4
Probability of getting a red ball = 4/8 = ½
Question : If a die is thrown in air, the probability of getting even numbers is:
(a) ½
(b) ⅙
(c) ⅓
(d) ⅔
Answer : (b)Show Answer :
Explanation: A die has six sides each consisting numbers from 1 to 6.
Number of even numbers in die = 3 (2,4,6)
Total possible outcomes = 6
Probability = 3/6 = 1/2
Question : Pictorial representation of data using symbols is known as:
(a) Bargraph
(b) Pictograph
(c) Piechart
(d) None of these
Answer : (b)Show Answer :
Question : Double bar graphs display ______ sets of data simultaneously.
(a) Four
(b) Three
(c) Two
(d) No
Answer : (c)Show Answer :
Question : _________ gives the number of times a particular entry occurs.
(a) Organisation of data
(b) Collection of Data
(c) Representation of Data
(d) Frequency distribution table
Answer : (d)Show Answer :
Question : In grouped data, each of the group is called:
(a) Class interval
(b) Collection of data
(c) Frequency
(d) Grouped frequency distribution
Answer : (a)Show Answer :
Question : If 20-30 is the class interval of grouped data, then lower class limit is:
(a) 50
(b) 30
(c) 20
(d) 10
Answer : (c)Show Answer :
Question : The difference between the upper class limit and lower class limit of a class interval is called:
(a) Frequency
(b) Width
(c) Grouped data
(d) Ungrouped data
Answer : (b)
Show Answer :
Frequency distribution of daily income of 550 workers of a factory is given bellow
Read the table given above and answer the following questions (Q1 – Q5)
Question Q1:What is the size of class intervals?
(a) 24
(b) 25
(c) 26
(d) 15
Answer : (b)Show Answer :
Question Q2: Which class has the highest frequency?
(a) 200-225
(b) 300-325
(c) 175-200
(d) 150-175
Answer : (a)Show Answer :
Question Q3: Which class has the lowest frequency?
(a) 100-125
(b) 300-325
(c) 175-200
(d) 150-175
Answer : (b)Show Answer :
Question Q4: What is the upper limit of the class interval 250-275?
(a) 250
(b) 275
(c) 25
(d) 525
Answer : (b)Show Answer :
Question Q5: Which two classes have the same frequency?
(a) III & IV
(b) I & II
(c) II & V
(d) V & VI
Answer : (a)Show Answer :
The number of hours for which students of particular class watched television during holidays is shown through the graph given below:
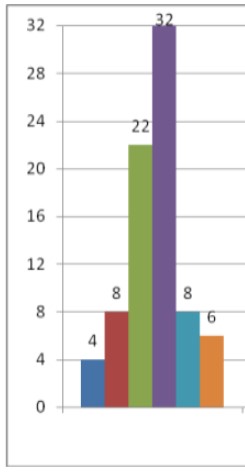
Question : For how many hours did the maximum number of students watch TV?
(a) 4-5 hrs
(b) 6-7 hrs
(c) 3-4 hrs
(d) 2-3hrs
Answer : (a)Show Answer :
Question : How many students watched TV for less than 4 hrs?
(a) 12
(b) 34
(c) 4
(d) 8
Answer : (b)Show Answer :
Question : How many students spent more than 5 hrs in TV watching?
(a) 14
(b) 0
(c) 6
(d) 8
Answer : (a)Show Answer :
Question : For how many hours did the minimum number of students watch TV?
(a) 2-3 hrs
(b) 6-7 hrs
(c) 1-2 hrs
(d) 3-4hrs
Answer : (c)Show Answer :
Question : How many students spent less than 5 hrs in TV watching?
(a) 34
(b) 32
(c) 8
(d) 66
Answer : (d)Show Answer :
Adjoining pie-chart gives the expenditure (in %age) on various items and savings of a family during a month .
Study the given pie chart and answer the following questions (Q11-Q15)
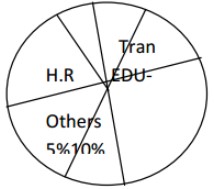
Question : On which item the expenditure was maximum?
(a) food
(b) education
(c) others
(d) transport
Answer : (a)Show Answer :
Question : On which item the expenditure was minimum?
(a) food
(b) education
(c) others
(d) transport
Answer : (d)Show Answer :
Question : Expenditure on which item is equal to total savings of the family?
(a) food
(b) education
(c) others
(d) transport
Answer : (b)Show Answer :
Question : If the monthly savings of the family is Rs 3000, What is the monthly expenditure on cloths?
(a) 3000
(b) 2000
(c) 2500
(d) 1000
Answer : (b)Show Answer :
Question : What is the monthly expenditure on education for children?
(a) 3000
(b) 2000
(c) 2500
(d) 1000
Answer : (a)Show Answer :
Numbers 1 to 10 are written on ten separates slips (one number on one slip ), kept in a
box and mixed well. One slip is chosen from the box without looking in to it .Answer the
following questions (Q16-Q20)
Question : What is the probability of getting a number 6?
(a) 1
(b) 0
(c)
(d)
Answer : (c)Show Answer :
Question : What is the probability of getting a number less than 6?
(a) 1
(b) 0
(c)
(d)
Answer : (d)Show Answer :
Question : What is the probability of getting a number greater than 6?
(a) 1
(b) 0
(c)
(d)
Answer : (d)Show Answer :
Question : What is the probability of getting a 1-digit number?
(a) 1 (b) 0
(c)
(d) \(\frac{9}{10\)
Answer : (d)Show Answer :
Question : What is the probability of getting an even number?
(a) 1
(b) 0
(c)
(d)
Answer : (d)Show Answer :
Question : A coin is tossed. Which of the following is the probability of getting a head or tail?
(a) 0
(b) 1
(c) 1/2
(d) None of these
Answer :(d) 1Show Answer :
Question : On which item has the minimum expenditure been done ?
(a) Servant’s salary
(b) Food
(c) Rent
(d) Conveyance.
Answer :(a) Servant’s salaryShow Answer :
Question : If a coin is flipped in the air, what is the probability of getting a tail?
(a) 0
(b) ½
(c) 1
(d) 2
Answer :(d) ½Show Answer :
Question : In the interval 50-60, 60 is called
(a) upper limit
(b) lower limit
(c) range
(d) frequency
Answer :(a) upper limitShow Answer :
Question : The number of times an observation occurs in a data is called its
(a) Range
(b) Interval
(c) Frequency
(d) Raw data
Answer :(c) FrequencyShow Answer :
Question : The central total angle in a pie chart is
(a) 180°
(b) 210°
(c) 360°
(d) None of these
Answer :(c) 360°Show Answer :
Question : What is the difference of expenditures done on conveyance and rent ?
(a) Rs 1000
(b) Rs 2000
(c) Rs 3000
(d) Rs 4000.
Answer :(d) Rs 2000Show Answer :
Question : A bag has 4 red balls and 4 green balls, what is the probability of getting a red ball randomly?
(a) 1/4
(b) 1/8
(c) 1/2
(d) 0
Answer :(c) 1/2Show Answer :
Question : Tally marks are used to find which of the following
(a) lower limits
(b) upper limits
(c) class marks
(d) frequency
Answer :(d) frequencyShow Answer :
Question : There are 2 Red, 3 Blue and 5 Black balls in a bag. A ball is drawn from the bag without looking in to the bag. What is the probability of getting a red ball?
(a) 2/5
(b) 3/5
(c) 1/5
(d) None of these
Answer :(c) 1/5Show Answer :
Question : 18 out of 36 people love reading, so reading in the pie chart will be represented by
(a) 36 degree sector
(b) quarter sector
(c) semi circular sector
(d) None of these
Answer :(c) semi circular sectorShow Answer :
Question : Rs 5000 is the expenditure done on
(a) rent
(b) food
(c) fee
(d) recreation.
Answer :(d) foodShow Answer :
Question : If a die is thrown in air, the probability of getting even numbers is:
(a) ½
(b) ⅙
(c) ⅓
(d) ⅔
Answer :(d) ⅙Show Answer :
Question : In the interval (0 – 10), 10 is called the
(a) lower limit
(b) upper limit
(c) range
(d) frequency
Answer :(d) upper limitShow Answer :
Question : Two dice are thrown, find and number of outcomes.
(a) 36
(b) 6
(c) 12
(d) None of these
Answer :(a) 36Show Answer :
Question : The pie-chart is divided into
(a) circles
(b) squares
(c) sectors
(d) segments
Answer :(c) sectorsShow Answer :
Question : How much expenditure has been done in all ?
(a) Rs 21000
(b) Rs 18000
(c) Rs 15000
(d) Rs 20000.
Answer :(a) Rs 21000Show Answer :
Question : In grouped data, each of the group is called:
(a) Class interval
(b) Collection of data
(c) Frequency
(d) Grouped frequency distribution
Answer :(a) Class intervalShow Answer :
Question : The class-mark of the class 20-30 is:
(a) 20
(b) 30
(c) 25
(d) 10
Answer :(c) 25Show Answer :
Question : A coin is tossed. Which of the following is the probability of getting a head or tail?
(a) 0
(b) 1
(c) 1/2
(d) None of these
Answer :(d) 1Show Answer :
Question : When a coin is thrown, total number of possible outcomes is __.
(a) 2
(b) 5
(c) 6
(d) None of these
Answer :(a) 2Show Answer :
Question : How many books are there of the subject whose books are maximum ?
(a) 100
(b) 200
(c) 300
(d) 400.
Answer :(d) 400.Show Answer :
Question : The difference between the upper class limit and lower class limit of a class interval is called:
(a) Frequency
(b) Width
(c) Grouped data
(d) Ungrouped data
Answer :(d) WidthShow Answer :
Question : Two dice are thrown, find and number of outcomes.
(a) 36
(b) 6
(c) 12
(d) None of these
Answer :(a) 36Show Answer :
Question : 300 books are of the subject
(a) Maths
(b) English
(c) Hindi
(d) Science.
Answer :(a) MathsShow Answer :
Question : Which class has the highest frequency?
(a) 200-225
(b) 300-325
(c) 175-200
(d) 150-175
Answer :(a) 200-225Show Answer :
Question : The number of times an observation occurs in a data is called its
(a) Range
(b) Interval
(c) Frequency
(d) Raw data
Answer :(c) FrequencyShow Answer :
Question : Which two classes have the same frequency ?
(а) 15-20 and 35-40
(b) 20-25 and 30-35
(c) 15-20 and 30-35
(d) 20-25 and 25-30.
Answer :(d) 20-25 and 30-35Show Answer :
Question : Which two classes have the same frequency?
(a) III & IV
(b) I & II
(c) II & V
(d) V & VI
Answer :(a) III & IVShow Answer :
Question :Numbers 1 to 10 are written on ten separates slips (one number on one slip), kept in a box and mixed well. One slip is chosen from the box without looking in to it. What is the probability of getting a number greater than 6?
(a) 1
(b) 0
(c)
(d)
Answer : (d) Show Answer :
Question :There are 2 Red, 3 Blue and 5 Black balls in a bag. A ball is drawn from the bag without looking in to the bag. What is the probability of getting a non-blue ball?
(a)
(b)
(c)
(d) None of these
Answer : (a) Show Answer :
Question :A coin is tossed. Which of the following is the probability of getting a head or tail?
(a) 0
(b) 1
(c)
(d) None of these
Answer : (b) 1Show Answer :
Question :There are 2 Red, 3 Blue and 5 Black balls in a bag. A ball is drawn from the bag without looking in to the bag. What is the probability of getting a non-red ball?
(a)
(b)
(c)
(d) None of these
Answer : (b) Show Answer :
Question :The central total angle in a pie chart is
(a) 180°
(b) 210°
(c) 360°
(d) None of these
Answer : (c) 360°Show Answer :
Question :There are 2 Red, 3 Blue and 5 Black balls in a bag. A ball is drawn from the bag without looking in to the bag. What is the probability of getting a blue ball?
(a)
(b)
(c)
(d) None of these
Answer : (c) Show Answer :
Question :18 out of 36 people love reading, so reading in the pie chart will be represented by
(a) 36 degree sector
(b) quarter sector
(c) semi circular sector
(d) None of these
Answer : (c) semi circular sectorShow Answer :
Question :When a die is thrown, total number of possible outcomes is ______.
(a) 6
(b) 36
(c) 2
(d) None of these
Answer : (a) 6Show Answer :
Question :The pie-chart is divided into
(a) circles
(b) squares
(c) sectors
(d) segments
Answer : (c) sectorsShow Answer :
Question :The class mark of 95-100 is
(a) 95.5
(b) 97.5
(c) 95
(d) 100
Answer : (b) 97.5Show Answer :
Question :In the class- interval 70-80, 80 is the
(a) upper limit
(b) frequency
(c) range
(d) lower limit
Answer : (a) upper limitShow Answer :
Question :When a coin is thrown, total number of possible outcomes is ______.
(a) 2
(b) 5
(c) 6
(d) None of these
Answer : (a) 2Show Answer :
Question :Numbers 1 to 10 are written on ten separates slips (one number on one slip), kept in a box and mixed well. One slip is chosen from the box without looking in to it. What is the probability of getting a 1-digit number ?
(a) 1
(b) 0
(c)
(d)
Answer : (d) Show Answer :
Question :There are 2 Red, 3 Blue and 5 Black balls in a bag. A ball is drawn from the bag without looking in to the bag. What is the probability of getting a black ball?
(a)
(b)
(c)
(d) None of these
Answer : (c) Show Answer :
Question :Numbers 1 to 10 are written on ten separates slips (one number on one slip), kept in a box and mixed well. One slip is chosen from the box without looking in to it .What is the probability of getting a number 6?
(a) 1
(b) 0
(c)
(d)
Answer : (c) Show Answer :
Question :There are 2 Red, 3 Blue and 5 Black balls in a bag. A ball is drawn from the bag without looking in to the bag. What is the probability of getting a non-black ball?
(a)
(b)
(c)
(d) None of these
Answer : (c) Show Answer :
Question :Two dice are thrown, find and number of outcomes.
(a) 36
(b) 6
(c) 12
(d) None of these
Answer : (a) 36Show Answer :
Question :Which of the following is the probability of an impossible event?
(a) 0
(b) 1
(c) 2
(d) None of these
Answer : (a) 0Show Answer :
Question :There are 2 Red, 3 Blue and 5 Black balls in a bag. A ball is drawn from the bag without looking in to the bag. What is the probability of getting a red ball?
(a)
(b)
(c)
(d) None of these
Answer : (c) Show Answer :
Question :Numbers 1 to 10 are written on ten separates slips (one number on one slip), kept in a box and mixed well. One slip is chosen from the box without looking in to it. What is the probability of getting a number less than 6?
(a) 1
(b) 0
(c)
(d)
Answer : (d) Show Answer :
Question :The number of times an observation occurs in a data is called its
(a) Range
(b) Interval
(c) Frequency
(d) Raw data
Answer : (c) FrequencyShow Answer :
Question :If a coin is flipped in the air, what is the probability of getting a tail?
(a) 0
(b)
(c) 1
(d) 2
Answer : (b) Show Answer :
Question : Pictorial representation of data using symbols is known as:
(a) Bar graph
(b) Pictograph
(c) Pie chart
(d) None of these
Answer :BShow Answer :
Question : Double bar graphs display ______ sets of data simultaneously.
(a) Four
(b) Three
(c) Two
(d) No
Answer :CShow Answer :
Question : _________ gives the number of times a particular entry occurs.
(a) Organisation of data
(b) Collection of Data
(c) Representation of Data
(d) Frequency distribution table
Answer 😀Show Answer :
Question : In the grouped data, each of the group is called:
(a) Class interval
(b) Collection of data
(c) Frequency
(d) Grouped frequency distribution
Answer :AShow Answer :
Question : If 20-30 is the class interval of grouped data, then the lower class limit is:
(a) 50
(b) 30
(c) 20
(d) 10
Answer :CShow Answer :
Question : The difference between the upper-class limit and lower class limit of a class interval is called:
(a) Frequency
(b) Width
(c) Grouped data
(d) Ungrouped data
Answer :BShow Answer :
Question : The width or size of the class interval 30-40 is:
(a) 10
(b) 30
(c) 40
(d) 70
Answer :AShow Answer :
Explanation: Width of class interval = upper class limit-lower class limit
= 40 – 30
= 10
Question : If a coin is flipped in the air, what is the probability of getting a tail?
(a) 0
(b) ½
(c) 1
(d) 2
Answer :BShow Answer :
Explanation: A coin has two sides, Head and tails.
Probability = Number of possible outcomes/Total number of outcomes
We know that the tail is present on one side of a coin and in total there could be two outcomes H & T.
Hence, the probability of getting a tail = ½
Question : A bag has 4 red balls and 4 green balls, what is the probability of getting a red ball randomly?
(a) 1/4
(b) 1/8
(c) 1/2
(d) 0
Answer :CShow Answer :
Explanation: Total number of balls in bag = 4 + 4 = 8
Total number of red balls = 4
Probability of getting a red ball = 4/8 = ½
Question : If a die is thrown in the air, the probability of getting even numbers is:
(a) ½
(b) ⅙
(c) ⅓
(d) ⅔
Answer :AShow Answer :
Explanation: A die has six sides each consisting numbers from 1 to 6, i.e. {1, 2, 3, 4, 5, 6}.
Total possible outcomes = 6
Number of even numbers on a die = 3
i.e. {2, 4, 6}
Probability = 3/6 = 1/2
Question : What is the total number of students for all ranges?
(a) 12
(b) 14
(c) 50
(d) 60
Answer : D. 60Show Answer :
Explanation: Total number of students = 10 + 14 + 12 + 13 + 11 = 60
Question : How many students secured marks between 250 – 300?
(a) 10
(b) 11
(c) 13
(d) 14
Answer : AShow Answer :
Question : What is the upper limit in the given frequency distribution table?
(a) 350
(b) 450
(c) 500
(d) 400
Answer : A. 500Show Answer :
Explanation: The last class has the upper limit of 500, which is the upper limit for the whole table.
Question : How many students come under the marks range of 300 – 400?
(a) 12
(b) 26
(c) 14
(d) 25
Answer : B.24Show Answer :
Explanation:
Number of students from 300 – 350 = 12
Number of students from 350 – 400 = 14
Thus, the total number of students from 300 – 400 = 12 + 14 = 26
Question : What is the size of the class interval?
(a) 30
(b) 40
(c) 50
(d) 55
Answer : C. 50Show Answer :
Explanation: For any class, we can determine the class interval, by subtracting the lower limit from upper limit.
500 – 450 = 50
450 – 400 = 50
Question : A die is thrown. What is the probability of getting even prime number?
(a) ⅙
(b) ½
(c) ⅓
(d) ⅕
Answer : A. 1/6Show Answer :
Explanation: When a die is thrown,
Number of total possible outcomes = 6
Number of even prime numbers = 1 (2 is the only even prime number)
Thus, the probability of getting a even prime number,
P = 1/6
Question : When a coin is tossed, what are the possible outcomes?
(a) 1
(b) 2
(c) 3
(d) 0
Answer : BShow Answer :
Explanation: The possible outcomes are Head and Tail.
Question : When two coins are tossed, then what is the probability of getting Tails for both the coins?
(a) ½
(b) ¼
(c) ⅓
(d) None of these
Answer : B.¼Show Answer :
Explanation: When two coins are tossed, then the possible outcomes will be:
HH, HT, TH, TT
Thus, probability of getting tails for both the coins = ¼
Question : The number of times that a particular entry occurs is called:
(a) Frequency
(b) Class-interval
(c) Raw data
(d) Range
Answer : A. FrequencyShow Answer :
Question : What is the number of possible outcomes, when two dies are thrown, simultaneously?
(a) 6
(b) 12
(c) 36
(d) None of these
Answer : C. 36Show Answer :
Explanation: Number of possible outcomes of each dies = 6
For two dies, number of possible outcomes = 6 x 6 = 36