NCERT class 9 Mathematics MCQ (14)

Class 9 Mathematics MCQ Statistics

Class 9 Mathematics MCQ Statistics with Answers is Prepared Based on Latest Exam Pattern. Students can solve NCERT Class 9 Mathematics MCQ Statistics with Answers to know their preparation level.

Students who are searching for NCERT Class 9 Mathematics MCQ Statistics with Answers are compiled here to get good practice on all fundamentals. Know your preparation level on MCQ Questions for Class 9 Mathematics MCQ Statistics with Answers. You can also verify your answers from the provided Class 9 Mathematics MCQ Statistics with Answers. So, ace up your preparation with MCQ of Class 9 Mathematics MCQ & NCERT Textbook solutions Examinations.

NCERT Class 9 Mathematics MCQ Statistics with Answers

14-14-14-14-14-14-14-14-14

Question :One of the sides of a frequency polygon is
(a) either of the coordinate axes
(b) the x-axis
(c) neither of the coordinate axes
(d) the y-axis

Show Answer :

Answer : (b) the x-axis

Question :In order to draw a frequency polygon by using a histogram, which of the following statements is incorrect?
(a) Obtain the mid-points of three class- intervals of highest frequency on Y-axis, one adjacent to the first on its right and one adjacent to the last, on its left.
(b) Obtain the frequency distribution and draw a histogram representing it.
(c) Join these mid-points of the adjacent rectangles of the histogram by dotted line
(d) Obtain the mid points of the upper horizontal side of each rectangle.

Show Answer :

Answer : (a) Obtain the mid-points of three class- intervals of highest frequency on Y-axis, one adjacent to the first on its right and one adjacent to the last, on its left.

Question : The median of the data: 155, 160, 145, 149, 150, 147, 152, 144, 148 is
(a) 149
(b) 150
(c) 147
(d) 144

Show Answer :

Answer : a
Explanation: First arrange the data in ascending order.
144 145 147 148 149 150 152 155 160
Since, the number of observations here is odd, therefore,
Median = (n+1)/2 th = (9+1)/2 = 10/2 = 5th number = 149

Question : The median of the data: 17, 2, 7, 27, 15, 5, 14, 8, 10, 24, 48, 10, 8, 7, 18, 28 is:
(a) 10
(b) 24
(c) 12
(d) 8

Show Answer :

Answer : c
Explanation: Arrange the given data in ascending order:
2, 5, 7, 7, 8, 8, 10, 10, 14, 15, 17, 18, 24, 27, 28, 48
Since, the number of observations givere here is even, hence,
Median will be average of two middle terms.
n/2th = 16/2 = 8th term
(n/2 +1)th = (16/2 + 1)th = 9th term
Therefore,
Median = (10+14)/2 = 12

Question : The mode of the given data: 4, 6, 5, 9, 3, 2, 7, 7, 6, 5, 4, 9, 10, 10, 3, 4, 7, 6, 9, 9 is;
(a) 7
(b) 9
(c) 10
(d) 6

Show Answer :

Answer : b
Explanation: First arrange the data in order:
2, 3, 3, 4, 4, 4, 5, 5, 6, 6, 6, 7, 7, 7, 9, 9, 9, 9, 10, 10
Hence, mode = 9

Question : The value which appears very frequently in a data is called:
(a) Mean
(b) Median
(c) Mode
(d) Central tendency

Show Answer :

Answer : c

Question : The collection of information, collected for a purpose is called:
(a) Mean
(b) Median
(c) Mode
(d) Data

Show Answer :

Answer : d

Question : The mean of the data 2, 3, 4, 5, 0, 1, 3, 3, 4, 3 is
(a) 2
(b) 2.2
(c) 2.4
(d) 2.8

Show Answer :

Answer : d
Explanation: Mean = (2+3+4+5+0+1+3+3+4+3)/10 = 28/10 = 2.8

Question : Which of the following is not a measure of central tendency?
(a) Standard deviation
(b) Mean
(c) Median
(d) Mode

Show Answer :

Answer : a

Question : Find the range of the following data: 25, 18, 20, 22, 16, 6, 17, 15, 12, 30, 32, 10, 19, 8, 11, 20.
(a) 10
(b) 15
(c) 18
(d) 26

Show Answer :

Answer : d
Explanation: Range = Maximum value – Minimum value
Range = 32-6 = 26.

Question : What is the class mark of the class interval 90-120?
(a) 90
(b) 105
(c) 115
(d) 120

Show Answer :

Answer : b
Explanation: Class mark = (upper limit + lower limit)/2
Class mark = (120+90)/2
Class mark = 105

Question : In the class intervals 10-20, 20-30, 20 is included in which interval?
(a) 10-20
(b) 20-30
(c) Both the intervals
(d) None of the intervals

Show Answer :

Answer : b
Explanation: In the class intervals 10-20, 20-30, 20 is included in the interval 20-30, because the number is always included in the lower limit of the class interval.

Question : Find the class width for the grouped frequency distribution of the class intervals 1-20, 21-40, 41-60, ..
(a) 10
(b) 15
(c) 17
(d) 20

Show Answer :

Answer : d
Explanation: Class width is the same as the class size. The class size of the given intervals 1-20, 21-40, 41-60,.. is 20.

Question : The arithmetic mean of the first 5 natural numbers is
(a) 3
(b) 4
(c) 5
(d) 6

Show Answer :

Answer : a
Explanation: Arithmetic mean = (1+2+3+4+5)/5 
Arithmetic mean = 15/5 = 3

Question : Find the value of x, if the arithmetic mean of 4, 5, 6, 7, 8 and x is 7.
(a) 4
(b) 6
(c) 8
(d) 12

Show Answer :

Answer : d
Explanation: (4+5+6+7+8+x)/6 = 7
4+5+6+7+8+x = 7(6)
4+5+6+7+8+x = 42
30+x = 42
x = 42-30 = 12

Question :The mean of five observations is 15. If the mean of first three observations is 14 and that of last three is 17, then the third observation is
(a) 29
(b) 31
(c) 32
(d) 18

Show Answer :

Answer : (d) 18

Question :Mode of a set of observations is the value which
(a) is the sum of the observations
(b) occurs most frequently
(c) is the mean of the middle two observations
(d) divides the observations into two equal parts

Show Answer :

Answer : (b) occurs most frequently

Question :The mean for counting numbers through 100 is
(a) 47.5
(b) 51
(c) 50.5
(d) 49.5

Show Answer :

Answer : (c) 50.5

Question :The maximum frequency 10 is for the observation 4. Hence the mode of the data is
(a) 2
(b) 10
(c) 3
(d) 4

Show Answer :

Answer : (d) 4

Question :The collection of information, collected for a purpose is called:
(a) Mean
(b) Median
(c) Mode
(d) Data

Show Answer :

Answer : (d) Data

Question :Find median of following data: 83, 37, 70, 29, 45, 63, 41, 70, 34, 54
(a) 51
(b) 25
(c) 49.5
(d) 47

Show Answer :

Answer : (c) 49.5

Question :Class size for the following distribution: 0 – 0.25, 0.25 – 0.50, 0.50 – 0.75 is​
(a) 10
(b) 0. 25
(c) 50
(d) 2.5

Show Answer :

Answer : (b) 0. 25

Question :In an examination, ten students scored the following marks: 60, 58, 90, 51, 47, 81, 70, 95, 87, 99. The range of this data is
(a) 52
(b) 51
(c) 81
(d) 60

Show Answer :

Answer : (a) 52

Question :Out of sixteen observations arranged in ascending order, the 8th and 9th observations are 25 and 27. Then, the median is
(a) 26
(b) 27
(c) 25
(d) 26.5

Show Answer :

Answer : (a) 26

Question : Which of the following is not a measure of central tendency?
(a) Standard deviation
(b) Mean
(c) Median
(d) Mode

Show Answer :

Answer :(a) Standard deviation

Question : The mean of x+2, x+3, x+4 and x-2 is:
(a) (x+7)/4
(b) (2x+7)/4
(c) (3x+7)/4
(d) (4x+7)/4

Show Answer :

Answer :(d) (4x+7)/4

Question : In the class intervals 10-20, 20-30, the number 20 is included in:
(a) 10-20
(b) 20-30
(c) both the intervals
(d) none of these intervals

Show Answer :

Answer :(b) 20-30

Question : One of the sides of a frequency polygon is
(a) either of the coordinate axes
(b) the x-axis
(c) neither of the coordinate axes
(d) the y-axis

Show Answer :

Answer :(b) the x-axis

Question : In a grouped frequency distribution, the class intervals are 1-20, 21-40, 41-60, . . , then the class width is
(a) 10
(b) 10.5
(c) 15
(d) 20

Show Answer :

Answer :(d) 20

Question : The mean for counting numbers through 100 is
(a) 47.5
(b) 51
(c) 50.5
(d) 49.5

Show Answer :

Answer :(c) 50.5

Question : The median of the data 78, 56, 22, 34, 45, 54, 39, 68, 54, 84 is
(a) 45
(b) 49.5
(c) 54
(d) 56

Show Answer :

Answer :(c) 54

Question : To analyse the election results, the data is collected from a newspapers. The data thus collected is known as
(a) secondary data
(b) raw data
(c) grouped data
(d) primary data

Show Answer :

Answer :(a) secondary data

Question : Out of sixteen observations arranged in ascending order, the 8th and 9th observations are 25 and 27. Then, the median is
(a) 26
(b) 27
(c) 25
(d) 26.5

Show Answer :

Answer :(a) 26

Question : Class mark of a class interval U-L is
(a) U+L/2
(b) U-L/2
(c) U-L
(d) 2(U+L)

Show Answer :

Answer :(a) U+L/2

Question : A student collects information about the number of school going children in a locality consisting of a hundred households. The data collected by him is
(a) Arrayed data
(b) Grouped data
(c) Primary data
(d) Secondary data

Show Answer :

Answer :(c) Primary data

Question : The mode of the given data: 4, 6, 5, 9, 3, 2, 7, 7, 6, 5, 4, 9, 10, 10, 3, 4, 7, 6, 9, 9 is;
(a) 7
(b) 9
(c) 10
(d) 6

Show Answer :

Answer :(b) 9

Question : The ratio of the sum of observations and the total number of observations is called:
(a) Mean
(b) Median
(c) Mode
(d) Central tendency

Show Answer :

Answer : a

Question : The mean of x+2, x+3, x+4 and x-2 is:
(a) (x+7)/4
(b) (2x+7)/4
(c) (3x+7)/4
(d) (4x+7)/4

Show Answer :

Answer : d
Explanation: Mean = (x+2+x+3+x+4+x-2)/4 = (4x+7)/4

Question : The median of the data: 4, 6, 8, 9, 11 is
(a) 6
(b) 8
(c) 9
(d) 11

Show Answer :

Answer : b

Question : Find the mode of the following data: 15, 14, 19, 20, 14, 15, 16, 14, 15, 18, 14, 19, 15, 17, 15.
(a) 14
(b) 15
(c) 16
(d) 17

Show Answer :

Answer : b
Explanation: The mode of the data 15, 14, 19, 20, 14, 15, 16, 14, 15, 18, 14, 19, 15, 17, 15 is 15, because the number 15 is repeated 5 times.

Question : If each data in the observation is increased by 5, then the mean 
(a) Remains the same
(b) Increased by 5
(c) Decreased by 5
(d) None of the above

Show Answer :

Answer : b
Explanation: If each data in the observation is increased by 5, then the mean is also increased by 5 because the mean is the average of the given values.

Question : The difference between the maximum and minimum values of the given observation is called 
(a) Class
(b) Class interval
(c) Classmark
(d) Range

Show Answer :

Answer : d
Explanation: The difference between the maximum and minimum values of the given observation is called range.

Question : Find the maximum value if the range is 38 and the minimum value is 82.
(a) 60
(b) 76
(c) 120
(d) 82

Show Answer :

Answer : c
Explanation: We know that Range = Maximum value – Minimum value.
Let the unknown value, (i.e) Maximum value be x.
Now, substitute the values, 
38 = x – 82
x = 38+82
x = 120.
Therefore, the maximum value is 120.

Question : The mean of 1, 3, 4, 5, 7, 4 is m. The numbers 3, 2, 2, 4, 3, 3, p have mean m – 1 and median q. Then, p + q =
(a) 4
(b) 5
(c) 6
(d) 7

Show Answer :

Answer 😀

Question : The mean of 9 observations is 36. If the mean of the first 5 observations is 32 and that of the last 5 observations is 39, then the fifth observation is _____.
(a) 28
(b) 31
(c) 43
(d) 37

Show Answer :

Answer :B

Question : if ui = xi – 25/10, Σfiui = 20, Σfi = 100. then x̅ =
(a) 23
(b) 24
(c) 27
(d) 25

Show Answer :

Answer :C

Question : The average monthly income (in ₹) of certain agricultural workers is S and that of other workers is T. The number of agricultural workers are 11 times that of other workers. Then the average monthly income (in ₹)of all the workers is ____.
(a) S + T / 2
(b) S +11T / 2
(c) 1 / 11 + T
(d) 11S + T / 12

Show Answer :

Answer 😀

Question : A bus maintains an average speed of 60 km/hr while going from P to Q and maintains an average speed of 90 km/hr while coming back from Q to P. The average speed of the bus is _____.
(a) 75 km/hr
(b) 72 km/hr
(c) 70 km/hr
(d) 30 km/hr

Show Answer :

Answer :B

Question : The mean weight of a class of 34 students is 46.5 kg. If the weight of the teacher is included, the mean rises by 500 g. Then the weight of the teacher is _____.
(a) 175 kg
(b) 62 kg
(c) 64 kg
(d) 72 kg

Show Answer :

Answer :C

Question : Candidates of four school appear in a mathematics test. The data is as follows:

MCQ Questions for Class 9 Statistics

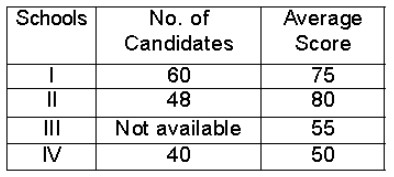
If the average score of the candidates of all the four schools is 66, find the number of candidates that appeared from school III.
(a) 51
(b) 52
(c) 50
(d) 53

Show Answer :

Answer :B

Question : The mean of six numbers is 21. If one number is excluded, then their mean is 19, the excluded number is ______.
(a) 31
(b) 26
(c) 28
(d) 25

Show Answer :

Answer :A

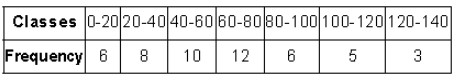
Question : Find the mode for the following data.
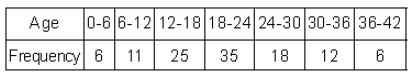
MCQ Questions for Class 9 Statistics

(A) 20.22
(b) 19.47
(c) 21.12
(d) 20.14

Show Answer :

Answer :A

Question : If 7, 2, 9 and 5 occur with frequencies 2, 3, 6 and 4 respectively, then the arithmetic mean is _____.
(a) 6.25
(b) 6.75
(c) 6.27
(d) 6.42

Show Answer :

Answer :C

Question : Which of the following is not a measure of central tendency ?
(a) Mean
(b) Median
(c) Mode
(d) Standard deviation

Show Answer :

Answer 😀

Question : The mean of 20 observations is 12.5. Byerror, one observation was noted as –15 instead of 15. Then the correct mean is _____.
(a) 11.75
(b) 11
(c) 14
(d) 13

Show Answer :

Answer :C

Question : The median of a given frequency distribution is found graphically with the help of ____.
(a) Histogram
(b) Frequency curve
(c) Frequency polygon
(d) Ogive 

Show Answer :

Answer 😀

Question : Find the value of p, if the mean of the following data is 20.
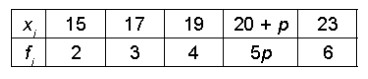
MCQ Questions for Class 9 Statistics

Show Answer :

Answer :B

Question : The average temperature of the town in the first four days of a month was 58 degree. The average for the second, third, fourth and fifth days was 60 degree. If the temperatures of the first and fifth days were in the ratio 7 : 8, then what is the temperature on the fifth day?
(a) 64 degree
(b) 62 degree
(c) 56 degree
(d) None of these

Show Answer :

Answer :A

Question : Fill in the blanks.
(i) For a given data with 110 observations the ‘less than ogive’ and ‘more than ogive’ intersect at (18, 20). The median of the data is P .
(b) The curve is drawn by taking upper limit of class interval along x-axis and cumulating frequency along y-axis is Q than ogive.
(c) The mean of 50 numbers is 18, the new mean will be R if each observation is increased by 4.
(d) The mean of seven consecutive natural numbers is 20, then the largest number is S and smallest number of them is T .
           P     Q       R    S      T
(a)    18   Less    22   23   17
(b)    20   More   25   22   16
(c)   18   More    22   24   18
(d)   20   Less     25   22    16

Show Answer :

Answer :A

Question :The median of the following data is 525. Find the missing frequencies, if it is given that there are 100 observations in the data.
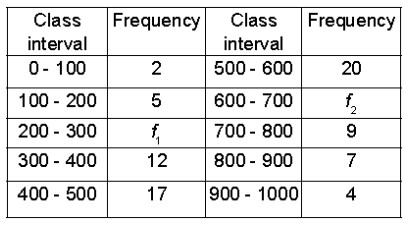
MCQ Questions for Class 9 Statistics

(A) 8, 14
(b) 11, 17
(c) 9, 15
(d) 10, 16

Show Answer :

Answer :C

Question : Find the mean, median and mode of the following data.

MCQ Questions for Class 9 Statistics

       Mean    Median     Mode
(a) 50.67      62.67       64.5
(b) 60.67      52.42       64.5
(c) 62.4        61.67       65
(d) 62.4       62.42       65

Show Answer :

Answer :C

Question : In an examination of 675 candidates of maximum marks 100 the examiner supplied the following information.

MCQ Questions for Class 9 Statistics

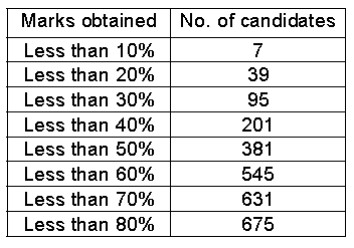
Calculate median and mode respectively of the percentage marks obtained.
(a) 47.58 , 46.33
(b) 49.12, 48.22
(c) 45.24, 46.22
(d) 47.58, 48.22

Show Answer :

Answer 😀

Question : One of the sides of a frequency polygon is
(a) either of the coordinate axes
(b) the x-axis
(c) neither of the coordinate axes
(d) the y-axis

Show Answer :

Answer :(b) the x-axis

Question : The median of the data: 155 160 145 149 150 147 152 144 148 is
(a) 149
(b) 150
(c) 147
(d) 144

Show Answer :

Answer :(a) 149

Question : The mean of five numbers is 30. If one number is excluded, their mean becomes 28. the excluded number is:
(a) 28
(b) 30
(c) 35
(d) 38

Show Answer :

Answer :(d) 38

Question :The minimum value o a data is 82 and range is 38, then the maximum value is
(a) 60
(b) 76
(c) 82
(d) 120

Show Answer :

Answer : (d) 120

Question :In a grouped frequency distribution, the class intervals are 0-10, 10-20, 20-30, .., then the class width is
(a) 10
(b) 15
(c) 20
(d) 30

Show Answer :

Answer : (a) 10

Question :Which of the following variables are discrete?

  1. Size of shoes
  2. Number of pages in a book
  3. Distance travelled by a train
  4. Time

(a) 1 and 2
(b) 1 and 4
(c) 1 and 3
(d) 2 and 4

Show Answer :

Answer : (a) 1 and 2

Question :Class mark of a class interval U-L is
(a) U+L2
(b) U-L2
(c) U-L
(d) 2(U+L)

Show Answer :

Answer : (a) U+L2

Question :Which of the following is not a measure of central tendency?
(a) Standard deviation
(b) Mean
(c) Median
(d) Mode

Show Answer :

Answer : (a) Standard deviation

Question :The mode of the given data: 4, 6, 5, 9, 3, 2, 7, 7, 6, 5, 4, 9, 10, 10, 3, 4, 7, 6, 9, 9 is;
(a) 7
(b) 9
(c) 10
(d) 6

Show Answer :

Answer : (b) 9

Question :Given the class intervals 1-10, 11-20, 21-30, ___, then 20 is considered in class
(a) 11-30
(b) 11-20
(c) 21-30
(d) 15-25

Show Answer :

Answer : (b) 11-20

Question :A student collects information about the number of school going children in a locality consisting of a hundred households. The data collected by him is
(a) Arrayed data
(b) Primary data
(c) Secondary data
(d) Grouped data

Show Answer :

Answer : (b) Primary data

Question : Class size for the following distribution: 0 – 0.25, 0.25 – 0.50, 0.50 – 0.75 is​
(a) 10
(b) 0. 25
(c) 50
(d) 2.5

Show Answer :

Answer :(b) 0. 25

Question : For a given data, the difference between the maximum and minimum observation is known as its
(a) class
(b) class mark
(c) range
(d) class limit

Show Answer :

Answer :(c) range

Question : Mode of a set of observations is the value which
(a) is the sum of the observations
(b) occurs most frequently
(c) is the mean of the middle two observations
(d) divides the observations into two equal parts

Show Answer :

Answer :(b) occurs most frequently

CBSE Class 9 Mathematics MCQ Surface Areas and Volumes with Answers
Number System : Exercise – 1.1Polynomials : Exercise – 2.1
Number System : Exercise – 1.2Polynomials : Exercise – 2.2
Number System : Exercise – 1.3Polynomials : Exercise – 2.3
Number System : Exercise – 1.4Coordinate Geometry : Exercise – 3.1
Number System : Exercise – 1.5Coordinate Geometry : Exercise – 3.2
Number System : Exercise – 1.6Coordinate Geometry : Exercise – 3.3
Linear Equations in Two Variables : Exercise – 4.1Introduction to Euclid’s Geometry :  Exercise – 5.1
Linear Equations in Two Variables : Exercise – 4.2Introduction to Euclid’s Geometry : Exercise – 5.2
Linear Equations in Two Variables : Exercise – 4.3Introduction to Euclid’s Geometry : Exercise – 5.3
Linear Equations in Two Variables : Exercise – 4,4Lines And Angles : Exercise – 6.1
Triangles : Exercise – 7.1Lines And Angles : Exercise – 6.2
Triangles : Exercise – 7.2Lines And Angles : Exercise – 6.3
Triangles : Exercise – 7.3Quadrilaterals : Exercise – 8.1
Triangles : Exercise – 7.4Areas of Parallelograms and Triangles : Exercise – 9.1
Triangles : Exercise – 7.5Areas of Parallelograms and Triangles : Exercise – 9.2
Circles : Exercise – 10.1Areas of Parallelograms and Triangles : Exercise – 9.3
Circles : Exercise – 10.2Areas of Parallelograms and Triangles : Exercise – 9.4
Circles : Exercise – 10.3Constructions : Exercise – 11.1
Circles : Exercise – 10.4Constructions : Exercise – 11.2
Circles : Exercise – 10.5Heron’s Formula : Exercise – 12.1
Circles : Exercise – 10.6Heron’s Formula : Exercise – 12.2
Surface Areas and Volumes : Exercise – 13.1Statistics : Exercise – 14.1
Surface Areas and Volumes : Exercise – 13.2Statistics : Exercise – 14.2
Surface Areas and Volumes : Exercise – 13.3Statistics : Exercise – 14.3
Surface Areas and Volumes : Exercise – 13.4Statistics : Exercise – 14.4
Surface Areas and Volumes : Exercise – 13.5Probability : Exercise – 15.1
Surface Areas and Volumes : Exercise – 13.6
Surface Areas and Volumes : Exercise – 13.7
Surface Areas and Volumes : Exercise – 13.8
Surface Areas and Volumes : Exercise – 13.9
CBSE Class 9 Mathematics MCQ Heron’s Formula with Answers
MCQ Questions Electrical Engineering Series Parallel Circuit

Related Posts

Leave a Reply