MCQ Class 10 Maths Statistics with Answers

CBSE Class 10 Mathematics Chapter 14 Statistics Multiple Choice Questions with Answers. MCQ Class 10 Maths Statistics with Answers was Prepared Based on Latest Exam Pattern. Students can solve NCERT Class 10 Mathematics Statistics MCQs with Answers to know their preparation level.

Multiple Choice Questions - Set - 2

Question 1: 

The abscissa of the point of intersection of the less than type and of the more than type cumulative frequency curves of a grouped data gives its 
(a) mean
(b) median
(c) mode
(d) all the three above

Correct Answer – (B)

Question 2 : 

Choose the correct answer from the given four options : In the formula

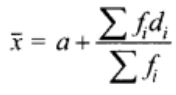
for finding the mean of grouped data d1 s are deviation from a of 
(a) lower limits of the classes
(b) upper limits of the classes
(c) mid points of the classes
(d) frequencies of the class marks

Correct Answer – (C)

Question 3 : 

di is the deviation of xi from assumed mean a. If mean =
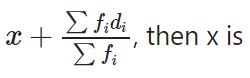
(a) class size ‘
(b) number of observations
(c) assumed mean
(d) none of these

Correct Answer – (C)

Question 4 : 

For the following distribution

Marks obtainedNo. of students
More than or equal to 063
More than or equal to 1058
More than or equal to 2055
More than or equal to 3051
More than or equal to 4048
More than or equal to 5042

the frequency of the class 20-30 is
(a) 35
(b) 4
(c) 48
(d) 51

Correct Answer – (B)

Question 5 : 

For the following distribution

Cl0-55-1010-1515-2020-25
f101512209

the difference of the upper limit of the median class and the lower limit of the modal class is
(a) 0
(b) 5
(c) 10
(d) -5

Correct Answer – (A)

Question 6 : 

While computing mean of grouped data, we assume that the frequencies are [NCERT Exemplar Problems]
(a) evenly distributed over all the classes
(b) centred at the classmarks of the classes
(c) centred at the upper limits of the classes
(d) centred at the lower limits of the classes

Correct Answer – (B)

Question 7 : 

Mean of 100 items is 49. It was discovered that three items which should have been 60, 70, 80 were wrongly read as 40, 20, 50 respectively. The correct mean is
(a) 48
(b) 49
(c) 50
(d) 60

Correct Answer – (C)

Sum of 100 observations
= 100 × 49 = 4900
Correct sum
= 4900 – [40 + 20 + 50 ] + [60 + 70 + 80] = 5000
∴ Correct mean = 5000/100 = 50.

Question 8 : 

The times, in seconds, taken by 150 atheletes to run a 100 m hurdle race are tabulated below:

C.I.f
13.8-143
14 – 14.24
14.2 – 14.46
14.4 – 14.669
14.6 – 14.848
14.8-1520

The number of atheletes who completed the race in less than 14.6 seconds is
(a) 13
(b) 69
(c) 82
(d) 130

Correct Answer – (C)

Question 9 : 

For the following distribution

Marks0-1010-2020-3030-4040-50
No. of students3913105

the number of students who got marks less than 30 is
(a) 13
(b) 25
(c) 10
(d) 12

Correct Answer – (B)

Question 10 : 

In the given data:

C.I.f
65-854
85 – 1055
105 – 12513
125 – 14520
145 – 16514
165 – 1857
185 – 2054

the difference of the upper limit of the median class and the lower limit of the modal class is
(a) 38
(b) 20
(c) 19
(d) 0

Correct Answer – (B)

Multiple Choice Questions – Chapter 13 – Surface Areas and Volumes

Related Posts

Leave a Reply