Class 8 Mathematics MCQ Introduction To Graphs with Answers is Prepared Based on Latest Exam Pattern. Students can solve NCERT Class 8 Mathematics MCQ Introduction To Graphs with Answers to know their preparation level.
Students who are searching for NCERT Class 8 Mathematics MCQ Introduction To Graphs with Answers are compiled here to get good practice on all fundamentals. Know your preparation level on MCQ Questions for Class 8 Mathematics MCQ Introduction To Graphs with Answers. You can also verify your answers from the provided Class 8 Mathematics MCQ Introduction To Graphs with Answers. So, ace up your preparation with MCQ of Class 8 Mathematics MCQ & NCERT Textbook solutions Examinations.
Question :On which head, is the expenditure maximum ?
(a) Travelling allowance
(b) Rent
(c) Appliances
(d) Salary of employees.
Answer : (d) Salary of employees.Show Answer :
Hint:
The length of the bar corresponding to the head ‘salary of employees’ is maximum.
Question :On which head/heads, is the expenditure minimum ?
(a) Travelling allowance/rent
(b) Appliances
(c) Salary of employees
(d) Others.
Answer : (a) Travelling allowance/rentShow Answer :
Hint:
The length of the bar corresponding to the head travelling allowance/rent is minimum.
Question :On which two heads, is the expenditure same ?
(a) Salary of employees and others
(b) Travelling allowance and rent
(c) Appliances and rent
(d) Appliances and others.
Answer : (b) Travelling allowance and rentShow Answer :
Hint:
The lengths of the bars corresponding to the heads travelling allowance and rent are the same.
Question :What is the difference of expenditures (in thousands of rupees) on salary of employees and rent ?
(a) 100
(b) 200
(c) 300
(d) 400.
Answer : (c) 300Show Answer :
Hint:
400 – 100 = 300
Question :What is the sum of the expenditures (in thousands of rupees) on travelling allowance and rent ?
(a) 100
(b) 200
(c) 300
(d) 400.
Answer : (b) 200Show Answer :
Hint:
100 + 100 = 200
Observe the following circle-graph and answer the related questions:
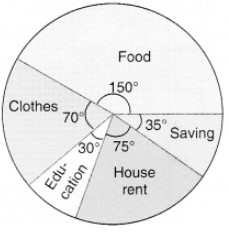
Question :On which head is the expenditure maximum ?
(a) Food
(b) Clothes
(c) House rent
(d) Education.
Answer : (a) FoodShow Answer :
Hint:
The central angle is maximum for food.
Question :On which head is the expenditure minimum ?
(a) Education
(b) House rent
(c) Food
(d) Clothes.
Answer : (a) EducationShow Answer :
Hint:
The central angle is minimum for education.
Question :If the budget of the family is Rs 10800, what is the saving ?
(a) Rs 1050
(b) Rs 1000
(c) Rs 950
(d) Rs 1200.
Answer : (a) Rs 1050Show Answer :
Hint:
Saving =
Question :What is the difference of expenditures on clothes and education if the budget of the family is Rs 10800 ?
(a) Rs 1200
(b) Rs 1000
(c) Rs 800
(d) Rs 1500.
Answer : (a) Rs 1200Show Answer :
Hint:
70 – 30 = 40
Question :What is the sum of the expenditures on food and education if the budget of the family is Rs 10800 ?
(a) Rs 5000
(b) Rs 8000
(c) Rs 5400
(d) Rs 6000.
Answer : (c) Rs 5400Show Answer :
Hint:
150 + 30 = 180
Observe the following histogram and answer the related questions:
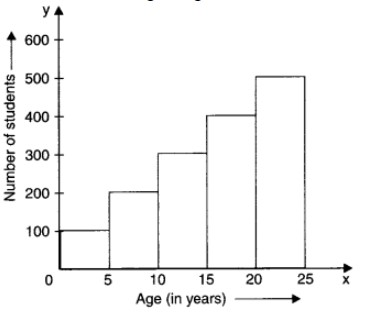
Question :In which class interval, are the maximum number of students ?
(a) 0-5
(b) 5-10
(c) 20-25
(d) 15-20.
Answer : (c) 20-25Show Answer :
Hint:
The length of the rectangle on 20 – 25 is maximum.
Question :In which class interval, are the minimum number of students ?
(a) 0-5
(b) 5-10
(c) 10-15
(d) 15-20.
Answer : (a) 0-5Show Answer :
Hint:
The length of the rectangle on 0 – 5 is maximum.
Question :In which class intervals, is the number of students 200 ?
(a) 5-10
(b) 0-5
(c) 20-25
(d) 15-20.
Answer : (a) 5-10Show Answer :
Hint:
5-10 → 200
Question :The difference in the number of students of class intervals 0-5 and 5-10 is
(a) 100
(b) 200
(c) 300
(d) 400.
Answer : (a) 100Show Answer :
Hint:
0-5 → 100
5-10 → 200
200-100 = 100
Question :The sum of the number of students in the class intervals 10-15 and 20-25 is
(a) 800
(b) 900
(c) 600
(d) 400.
Answer : (a) 800Show Answer :
Hint:
10-15 → 300
20-25 → 500
300 + 500 = 800.
Observe the following temperature time graph and answer the related questions:
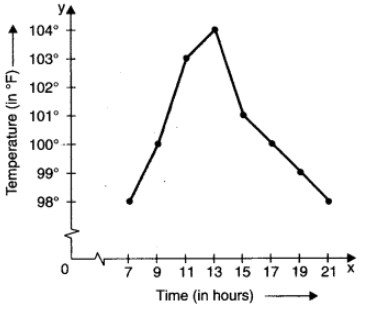
Question :At what time is the temperature maximum ?
(a) 13 hours
(b) 15 hours
(c) 11 hours
(d) 19 hours.
Answer : (a) 13 hoursShow Answer :
Hint:
13 hours → 104°F
Question :At what time(s) is the temperature minimum ?
(a) 7 hours and 21 hours
(b) 9 hours
(c) 11 hours
(d) 13 hours.
Answer : (a) 7 hours and 21 hoursShow Answer :
Hint:
7, 21 → 98°F
Question :103°F temperature is at time
(a) 11 hours
(b) 13 hours
(c) 15 hours
(d) 21 hours.
Answer : (a) 11 hoursShow Answer :
Hint:
103°F → 11 hours
Question :What is the difference of temperatures at 7 hours and 21 hours ?
(a) 0°F
(b) 1°F
(c) 2°F
(d) 3°F.
Answer : (a) 0°FShow Answer :
Hint:
98-98 = 0
Question :What is the rise in temperature from 11 hours to 13 hours ?
(a) 1°F
(b) 2°F
(c) 4°F
(d) 3°F.
Answer : (a) 1°FShow Answer :
Hint:
104 – 103 = 1
Question :What is the fall in temperature from 13 hours to 21 hours ?
(a) 2°F
(b) 3°F
(c) 4°F
(d) 6°F
Answer : (d) 6°FShow Answer :
Hint:
104 – 98 = 6
Question :The coordinates of the origin are
(a ) (0, 0)
(b) (1, 0)
(c) (0, 1)
(d) (1, 1).
Answer : (a ) (0, 0)Show Answer :
Hint:
0 → (0, 0)
Question :What are the coordinates of a point whose x-coordinate is 3 and y-coordinate is 4?
(a) (3, 3)
(b) (3, 4)
(c) (4, 3)
(d) (4, 3).
Answer : (b) (3, 4)Show Answer :
Question :What are the coordinates of a point whose x-coordinate is 1 and y-coordinate isO?
(a) (1, 0)
(b) (0, 0)
(c) (0, 1)
(d) (1, 1).
Answer : (a) (1, 0)Show Answer :
Question :What are the coordinates of a point whose x-coordinate is 0 and y-coordinate is 1?
(a) (0, 1)
(b) (0, 0)
(c) (1, o)
(d) (1, 1).
Answer : (a) (0, 1)Show Answer :
Observe the following velocity-time graph and answer the related questions:
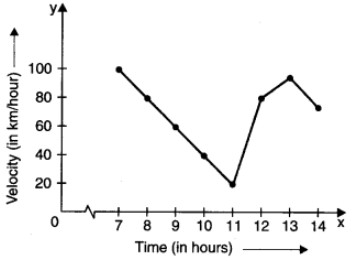
Question :At what time is the velocity maximum ?
(a) 7
(b) 8
(c) 9
(d) 10.
Answer : (a) 7Show Answer :
Hint:
7 → 100
Question :At what time is the velocity minimum ?
(a) 8
(b) 9
(c) 10
(d) 11.
Answer : (d) 11Show Answer :
Hint:
11 → 20
Question :At what times are the velocities equal ?
(a) 8 and 12
(b) 9 and 11
(c) 7 and 12
(d) 11 and 13.
Answer : (a) 8 and 12Show Answer :
Hint:
8 → 80
12 → 80
Question :What is the fall in velocity from 7 to 11 ?
(a) 80 km/hour
(b) 90 km/hour
(c) 100 km/hour
(d) 20 km/hour.
Answer : (a) 80 km/hourShow Answer :
Hint:
100 – 20 = 80
Question :What is the rise in velocity from 11 to 12?
(a) 10 km/hour
(b) 20 km/hour
(c) 30 km/hour
(d) 60 km/hour.
Answer : (d) 60 km/hourShow Answer :
Hint:
80 – 20 = 60
Observe the following runs-over graph and answer the related questions:

Question :In which over are the maximum runs scored ?
(a) II
(b) IV
(c) V
(d) VI.
Answer : (d) VIShow Answer :
Hint:
VI → 11
Question :In which over are the minimum runs scored ?
(a) X
(b) XI
(c) XII
(d) IX.
Answer : (c) XIIShow Answer :
Hint:
XII → 1
Question :What is the difference of runs scored in IV and V overs ?
(a) 1
(b) 2
(c) 3
(d) 4.
Answer : (a) 1Show Answer :
Hint:
8 – 7 = 1
Question :What is the sum of runs scored in I and XII overs ?
(a) 1
(b) 2
(c) 3
(d) 4.
Answer : (c) 3Show Answer :
Hint:
2 + 1 = 3
Question :3 runs are scored in which overs ?
(a) II and X
(b) I and V
(c) VII and VIII
(d) X and XII
Answer : (a) II and XShow Answer :
Hint:
II → 3, X → 3
Read the graph and answer the related questions:
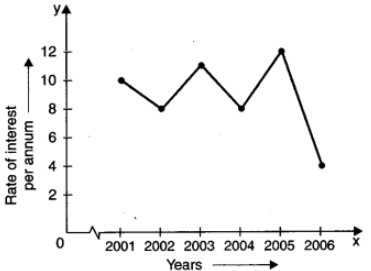
Question :In which year was the rate of interest maximum ?
(a) 2005
(b) 2003
(c) 2006
(d) 2002.
Answer : (a) 2005Show Answer :
Hint:
2005 → 12
Question :In which year was the rate of interest minimum ?
(a) 2006
(b) 2004
(c) 2001
(d) 2005.
Answer : (a) 2006Show Answer :
Hint:
2006 → 4
Question :The difference in the maximum and minimum rates of interest was
(a) 2%
(b) 4%
(c) 6%
(d) 8%.
Answer : (d) 8%Show Answer :
Hint:
12 – 4 = 8
Question :Rise in interest from 2004 to 2005 was
(a) 2%
(b) 4%
(c) 6%
(d) 8%.
Answer : (b) 4%Show Answer :
Hint:
12 – 8 = 4
Question :The fall in interest from 2001 to 2002 was
(a) 1%
(b) 2%
(c) 3%
(d) 4%.
Answer : (b) 2%Show Answer :
Hint:
10 – 8 = 2
Read the graph and answer the related questions:
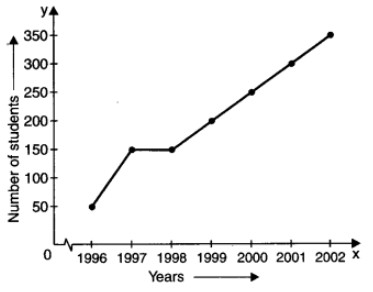
Question :How many students appeared in the year 2000 ?
(a) 200
(b) 250
(c) 300
(d) 350.
Answer : (b) 250Show Answer :
Hint:
2000 → 250
Question :In which year did 50 students appear ?
(a) 1998
(b) 2001
(c) 1997
(d) 1996.
Answer : (d) 1996Show Answer :
Hint:
50 → 1996
Question :In which year did the maximum number of students appear ?
(a) 2002
(b) 2000
(c) 2001
(d) 1999.
Answer : (a) 2002Show Answer :
Hint:
2002 → 350
Question :What is the maximum number of students that appeared in any year ?
(a) 350
(b) 300
(c) 250
(d) 300.
Answer : (a) 350Show Answer :
Hint:
350
Question :In which two years was the number of students appearing was the same ?
(a) 1997 and 1998
(b) 1998 and 1999
(c) 1999 and 2000
(d) 2000 and 2001.
Answer : (a) 1997 and 1998Show Answer :
Hint:
1997 → 150
1998 → 150
Read the graph and answer the related questions:
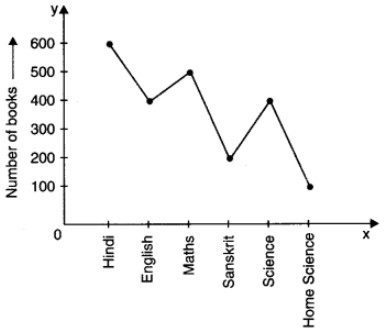
Question :The maximum books are of which subject ?
(a) Hindi
(b) Science
(c) English
(d) Sanskrit.
Answer : (a) HindiShow Answer :
Hint:
Hindi → 600
Question :The minimum books are of which subject ?
(a) Home Science
(b) Sanskrit
(c) Science
(d) English
Answer : (a) Home ScienceShow Answer :
Hint:
Home Science → 100
Question :500 books are of which subject ?
(a) English
(b) Science
(c) Hindi
(d) Maths.
Answer : (d) MathsShow Answer :
Hint:
500 → Maths
Question :How many books are of subject Home Science ?
(a) 100
(b) 200
(c) 300
(d) 400.
Answer : (a) 100Show Answer :
Hint:
Home Science → 100
Question :How many books are there in Sanskrit and Home Science taken together ?
(a) 100
(b) 200
(c) 300
(d) 400.
Answer : (c) 300Show Answer :
Hint:
Sanskrit → 200
Home Science → 100
200 + 100 = 300
Read the graph and answer the related questions:
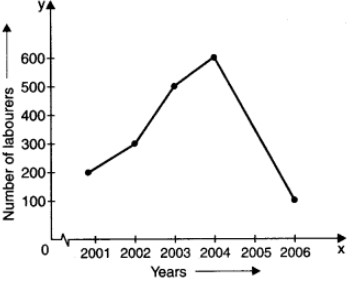
Question :In which year was the number of labourers maximum ?
(a) 2001
(b) 2002
(c) 2003
(d) 2004.
Answer : (d) 2004Show Answer :
Hint:
2004 → 500
Question :In which year was the number of labourers minimum ?
(a) 2003
(b) 2004
(c) 2005
(d) 2006.
Answer : (d) 2006Show Answer :
Hint:
2006 → 100
Question :What was the difference of the number of labourers in the years 2002 and 2003 ?
(a) 100
(b) 200
(c) 300
(d) 400.
Answer : (b) 200Show Answer :
Hint:
2002 → 300
2003 → 500
500 – 300 = 200
Question :Find the rise in the number of labourers from 2001 to 2004.
(a) 200
(b) 300
(c) 400
(d) 500.
Answer : (c) 400Show Answer :
Hint:
2001 → 200
2004 → 600
600 – 200 = 400
Question :Find the sum of the number of labourers in the years 2004 and 2006.
(a) 700
(b) 600
(c) 200
(d) 500.
Answer : (a) 700Show Answer :
Hint:
2004 → 600
2006 → 100
600 + 100 = 700
Read the circle graph and answer the related questions:
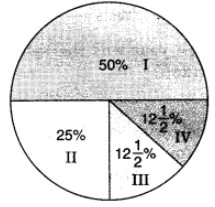
Question :There are in all 1000 students in a school. The number of students of class I are
(a) 500
(b) 250
(c) 125
(d) none of these.
Answer : (a) 500Show Answer :
Hint:
Question :The number of students of class II is
(a) 500
(b) 250
(c) 125
(d) 100.
Answer : (b) 250Show Answer :
Hint:
Question :In which two classes is the number of students the same ?
(a) I and II
(b) I and III
(c) III and IV
(d) I and IV.
Answer : (c) III and IVShow Answer :
Hint:
III → 12
IV → 12
Question :The minimum number of students in any class is
(a) 125
(b) 250
(c) 500
(d) 1000.
Answer : (a) 125Show Answer :
Hint:
Question :The sum of the number of students of class III and class IV is
(a) 500
(b) 1000
(c) 50
(d) 250.
Answer : (d) 250Show Answer :
Hint:
125 + 125 = 250
Question :A ________ is a graph that shows data in intervals.
(a) Bar-graph
(b) Pie-chart
(c) Histograph
(d) Line Graph
Answer : (c) HistographShow Answer :
Question :A graph that displays data that changes continuously over periods of time is called:
(a) Bar-graph
(b) Pie-chart
(c) Histograph
(d) Line Graph
Answer : (d) Line GraphShow Answer :
Question :A line graph which is a whole unbroken line is called a:
(a) Linear graph
(b) Pie-chart
(c) Histograph
(d) Bar-graph
Answer : (a) Linear graphShow Answer :
Question :Which point lies of y-axis?
(a) (-2, 0)
(b) (2, 0)
(c) (0, -2)
(d) (2, -2)
Answer : (c) (0, -2)Show Answer :
Question :If we join (-3,2), (-3,-3) and (-3,4), then we obtain:
(a) A triangle
(b) Straight-line without passing through origin
(c) Straight-line passing through origin
(d) None of the above
Answer : (b) Straight-line without passing through originShow Answer :
Question :The point (4, 0) lies on which of the following?
(a) x-axis
(b) y-axis
(c) origin
(d) None of the above
Answer : (a) x-axisShow Answer :
Question :The point (-2,-2) is:
(a) near to x-axis
(b) near to y-axis
(c) near to origin
(d) Equidistant from x-axis and y-axis.
Answer : (d) Equidistant from x-axis and y-axis.Show Answer :
Question :The point (-2, 5) is nearer to:
(a) x-axis
(b) y-axis
(c) origin
(d) None of the above
Answer : (a) x-axisShow Answer :
Question :The point (-5, 2) is nearer to:
(a) x-axis
(b) y-axis
(c) origin
(d) None of the above
Answer : (b) y-axisShow Answer :
Question :The point (0, 0) lies at:
(a) x-axis
(b) y-axis
(c) origin
(d) None of the above
Answer : (c) originShow Answer :
Question : Which of the points given is a point on the X-axis?
(a) (5,0)
(b) (0,5)
(c) (5,3)
(d) (3,5)
Answer :(a) (5,0)Show Answer :
Question : What is the sum of the expenditures (in thousands of rupees) on travelling allowance and rent ?
(a) 100
(b) 200
(c) 300
(d) 400.
Answer :(d) 200Show Answer :
Question : (0, y) are the coordinates of a point lying on which of the following?
(a) origin
(b) x-axis
(c) y-axis
(d) None of these
Answer :(c) y-axisShow Answer :
Question : On which axis does the point (0, 5) lie?
(a) origin
(b) x-axis
(c) y-axis
(d) None of these
Answer :(c) y-axisShow Answer :
Question : Which of the following statements is true?
(a) The X-axis is a vertical line.
(b) The Y-axis is a horizontal line.
(c) The scale on both the axes must be the same in a Cartesian plane.
(d) The point of intersection between the X-axis and Y-axis is called the origin.
Answer :(d) The point of intersection between the X-axis and Y-axis is called the origin.Show Answer :
Question : On which two heads, is the expenditure same ?
(a) Salary of employees and others
(b) Travelling allowance and rent
(c) Appliances and rent
(d) Appliances and others.
Answer :(d) Travelling allowance and rentShow Answer :
Question : What are the coordinates of a point whose x-coordinates is 0 and y-coordinate is 1?
(a) (0,1)
(b) (0,0)
(c) (1,0)
(d) (1,1)
Answer :(a) (0,1)Show Answer :
Question : In which quadrant does the point Q (-2, -6) lie?
(a) I
(b) II
(c) IV
(d) III
Answer :(d) IIIShow Answer :
Question :On which axis does the point (-1, 0) lie?
(a) x-axis
(b) origin
(c) y-axis
(d) None of these
Answer :(a) x-axisShow Answer :
Question : On which head is the expenditure minimum ?
(a) Education
(b) House rent
(c) Food
(d) Clothes.
Answer :(a) EducationShow Answer :
Question : Which of the following points lies on y-axis?
(a) (-4, 0)
(b) (4, 0)
(c) (0, -4)
(d) (-4, 4)
Answer :(c) (0,-4)Show Answer :
Question : Find the coordinates of the point A from the graph.
(a) (-4, 5)
(b) (-4, 0)
(c) (0, -4)
(d) none of these
Answer :(d) (-4, 0)Show Answer :
Question : What is the difference of expenditures on clothes and education if the budget of the family is Rs 10800 ?
(a) Rs 1200
(b) Rs 1000
(c) Rs 800
(d) Rs 1500.
Answer :(a) Rs 1200Show Answer :
Question : By joining (1, 1), (0, 0) and (3, 3), which of the following is obtained?
(a) A triangle
(b) A straight line passing through origin
(c) A curved line
(d) A straight line not passing through origin
Answer :(d) A straight line passing through originShow Answer :
Question : In which class interval, are the minimum number of students ?
(a) 0-5
(b) 5-10
(c) 10-15
(d) 15-20.
Answer :(a) 0-5Show Answer :
Question : The sum of the number of students in the class intervals 10-15 and 20-25 is
(a) 800
(b) 900
(c) 600
(d) 400.
Answer :(a) 800Show Answer :
Question : The point (3, 2) is nearer to:
(a) x-axis
(b) y-axis
(c) origin
(d) none of these.
Answer :(a) x-axisShow Answer :
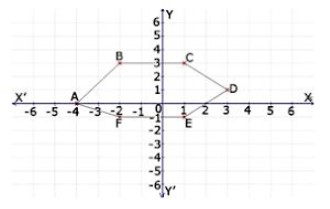
Question :Find the coordinates of the point A from the graph.
(a) (-4, 5)
(b) (-4, 0)
(c) (0, -4)
(d) none of these
Answer : (b) (-4, 0)Show Answer :
Question :Which of the following statements is true?
(a) The X-axis is a vertical line.
(b) The Y-axis is a horizontal line.
(c) The scale on both the axes must be the same in a Cartesian plane.
(d) The point of intersection between the X-axis and Y-axis is called the origin.
Answer : (d) The point of intersection between the X-axis and Y-axis is called the origin.Show Answer :
Question :The line graph shows the yearly sales figure for a manufacturing company. From the graph, what were the sales in 2006?
(a) Rs 8 millions
(b) Rs 4 millions
(c) Rs 3 millions
(d) Rs 5 millions
Answer : (a) Rs 8 millionsShow Answer :
Question :In which quadrant does the point Q (-2, -6) lie?
(a) I
(b) II
(c) IV
(d) III
Answer : (d) IIIShow Answer :
Question :Which of the points given is a point on the X-axis?
(a) (5,0)
(b) (0,5)
(c) (5,3)
(d) (3,5)
Answer : (a) (5,0)Show Answer :
Question :Find the distance covered in 2 seconds.

(a) 15 m
(b) 20 m
(c) 25 m
(d) 10 m
Answer : (d) 10 mShow Answer :
Question :Find the coordinates of the point E from the graph.
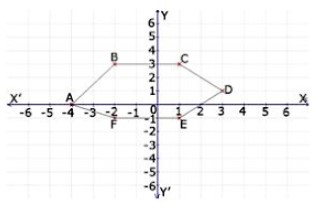
(a) (1, -1)
(b) (-4, 5)
(c) (0, -4)
(d) None of these
Answer : (a) (1, -1)Show Answer :
Question :Find the distance covered in 6 seconds.
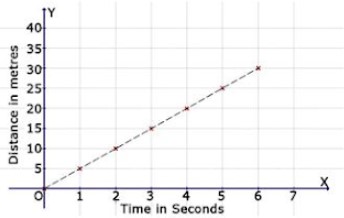
(a) 30 m
(b) 35 m
(c) 25 m
(d) none of these
Answer : (a) 30 mShow Answer :
Question :Find the distance covered in 7 seconds.
(a) 30 m
(b) 25 m
(c) 35 m
(d) 20 m
Answer : (c) 35 mShow Answer :
Question :Find the time taken by a body to cover 5 metres.
(a) 3 seconds
(b) 4 seconds
(c) 5 seconds
(d) 1 second
Answer : (d) 1 secondShow Answer :
Question :The line graph shows the yearly sales figure for a manufacturing company. From the graph, what were the sales in 2004?

(a) Rs 5 millions
(b) Rs 3 millions
(c) Rs 4 millions
(d) Rs 6 millions
Answer : (d) Rs 6 millionsShow Answer :
Question :On which axis does the point (-1, 0) lie?
(a) x-axis
(b) origin
(c) y-axis
(d) None of these
Answer : (a) x-axisShow Answer :
Question :Find the coordinates of the point C from the graph.
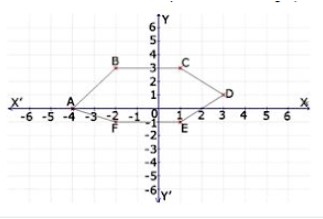
(a) (1, 3)
(b) (-4, 5)
(c) (0, -4)
(d) None of these
Answer : (a) (1, 3)Show Answer :
Question :On which axis does the point (0, 5) lie?
(a) origin
(b) x-axis
(c) y-axis
(d) None of these
Answer : (c) y-axisShow Answer :
Question :Find the coordinates of the point F from the graph.
(a) (-4, 5)
(b) (-2, -1)
(c) (0, -4)
(d) None of these
Answer : (b) (-2, -1)Show Answer :
Question :Find the distance covered in 5 seconds.

(a) 25 m
(b) 10 m
(c) 20 m
(d) none of these
Answer : (a) 25 mShow Answer :
Question : A ________ is a graph that shows data in intervals.
(a) Bar-graph
(b) Pie-chart
(c) Histograph
(d) Line Graph
Answer : CShow Answer :
Question : A graph that displays data that changes continuously over periods of time is called:
(a) Bar-graph
(b) Pie-chart
(c) Histograph
(d) Line Graph
Answer 😀Show Answer :
Question : A line graph which is a whole unbroken line is called a:
(a) Linear graph
(b) Pie-chart
(c) Histograph
(d) Bar-graph
Answer :AShow Answer :
Question : Which point lies only on y-axis?
(a) (-2,0)
(b) (2,0)
(c) (0,-2)
(d) (2,-2)
Answer :CShow Answer :
Question : If we join (-3,2), (-3,-3) and (-3,4), then we obtain:
(a) A triangle
(b) Straight-line without passing through origin
(c) Straight-line passing through origin
(d) None of the above
Answer :BShow Answer :
Question : The point (4,0) lies on which of the following?
(a) x-axis
(b) y-axis
(c) origin
(d) None of the above
Answer : AShow Answer :
Question : The point (-2,-2) is:
(a) near to x-axis
(b) near to y-axis
(c) near to origin
(d) Equidistant from x-axis and y-axis.
Answer 😀Show Answer :
Question : The point (-2, 5) is nearer to:
(a) x-axis
(b) y-axis
(c) origin
(d) None of the above
Answer :BShow Answer :
Question : The point (-5, 2) is nearer to:
(a) x-axis
(b) y-axis
(c) origin
(d) None of the above
Answer :AShow Answer :
Question : The point (0,0) lies at:
(a) x-axis
(b) y-axis
(c) origin
(d) None of the above
Answer :CShow Answer :
Observe the diagram, given below and find the correct answer to the following MCQs.
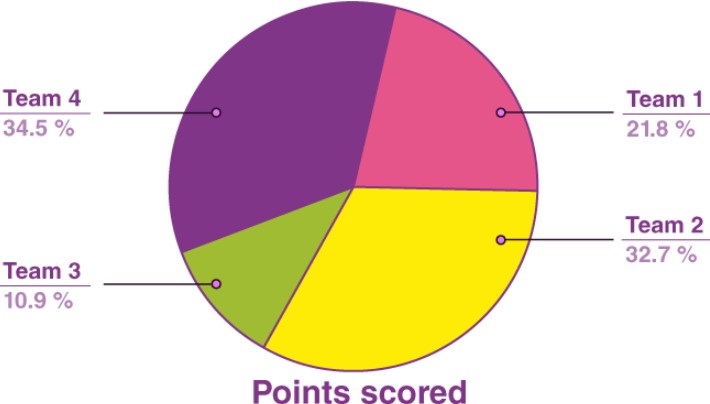
Question : Which team has the highest score?
(a) Team 1
(b) Team 2
(c) Team 3
(d) Team 4
Answer : D Team 4Show Answer :
Explanation: Team 4 has the highest score with 34.5%.
Question : Which team has the lowest score?
(a) Team 1
(b) Team 2
(c) Team 3
(d) Team 4
Answer : C. Team 3Show Answer :
Explanation: Team 3 has the lowest score with 10.9%.
Question : Which team is coloured green?
(a) Team 1
(b) Team 2
(c) Team 3
(d) Team 4
Answer : C. Team 3Show Answer :
Question : What is the average score of all the teams?
(a) 22%
(b) 25%
(c) 27%
(d) 29%
Answer : B. 25%Show Answer :
Explanation: Average score = (sum of all scores)/(total number of scores)
Question : Which team has the second-highest score?
(a) Team 1
(b) Team 2
(c) Team 3
(d) Team 4
Answer : A. Team 2Show Answer :
Below is the data of the number of men and women in a village for different years. Now based on this data answer the following MCQs with the correct option.
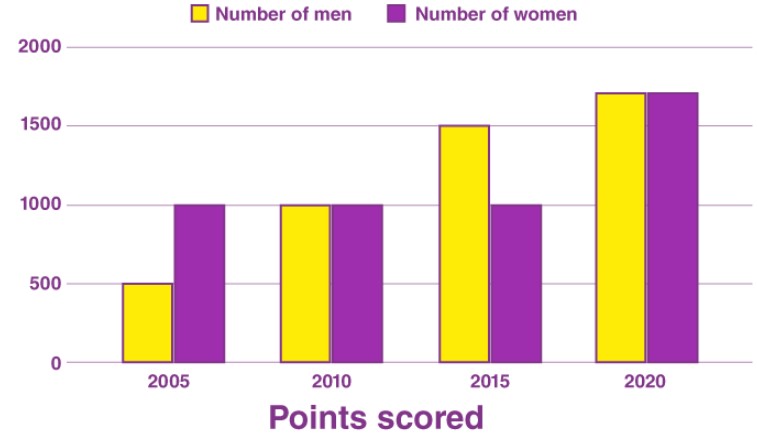
Question : How many men were there in the village in 2010?
(a) 500
(b) 1000
(c) 1500
(d) 2000
Answer : B. 1000Show Answer :
Explanation: There were 1000 men in the year 2010 in the village.
Question : The population of men and women in 2020 is the same?
(a) True
(b) False
Answer : A. TrueShow Answer :
Question : In which year the population of women is the highest?
(a) 2005
(b) 2010
(c) 2015
(d) 2020
Answer : D. 2020Show Answer :
Question : When is the population of men, the minimum?
(a) 2005
(b) 2010
(c) 2015
(d) 2020
Answer : A. 2005Show Answer :
Explanation: In 2005, there were only 500 men in the village.
Question : In which year population of men is more than women?
(a) 2005
(b) 2010
(c) 2015
(d) 2020
Answer : C. 2015Show Answer :